
Economic Resilience: 6 Metrics Every Consultant Should Track
Measure six monthly metrics to spot hidden risks and keep your consulting practice steady through client loss or slow months.
If I had to boil this article down to one point, it’s this: I can spot risk in my consulting business early by tracking 6 numbers every month: client concentration, cash runway, pipeline coverage, lead source mix, utilization with margin, and recurring revenue.
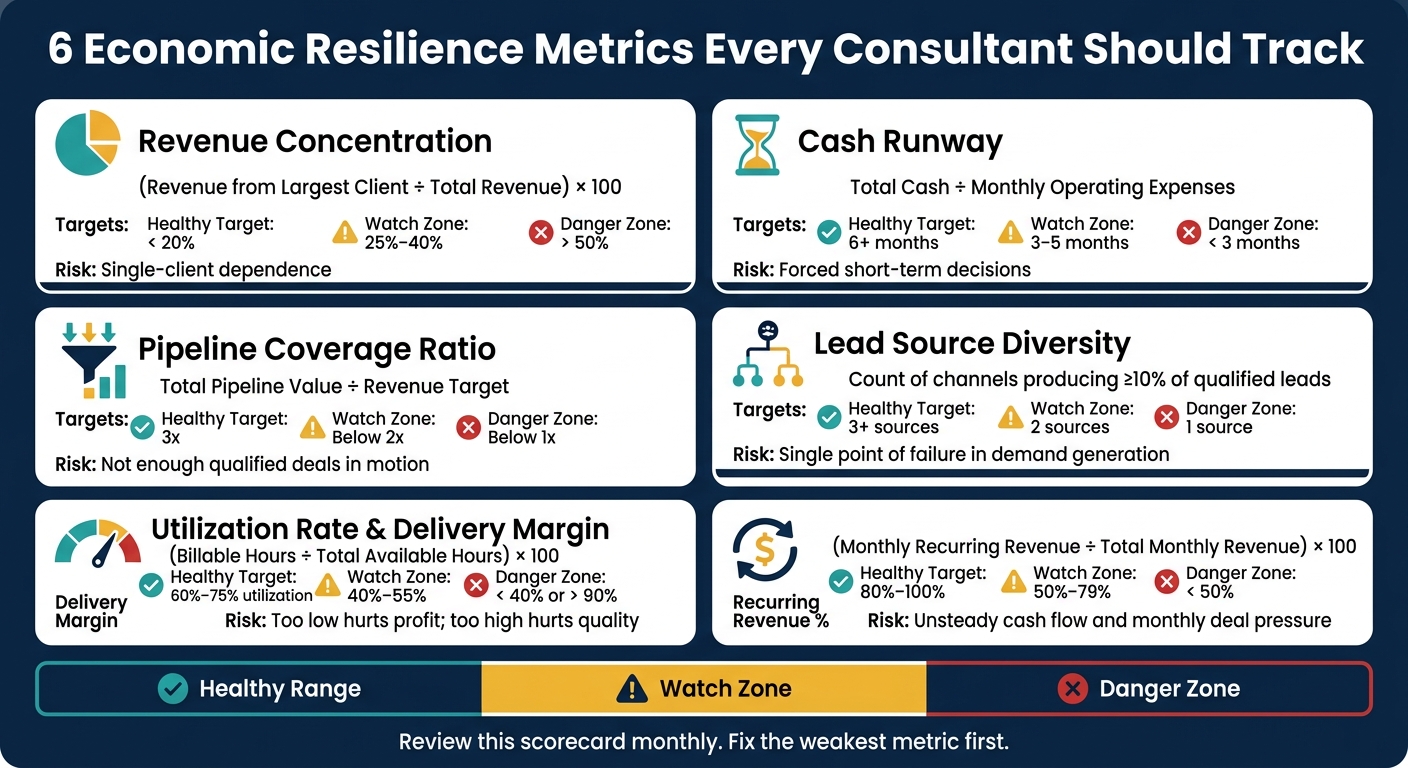
These metrics show whether my practice can handle a lost client, a delayed deal, or a slow month without forcing bad decisions. The article’s main benchmarks are simple: keep any one client below 20% of revenue, hold at least 6 months of cash runway, aim for 3x pipeline coverage, get leads from 3+ channels, keep utilization around 60%–75%, and push recurring revenue toward 80%–100% of monthly income.
Here’s the quick takeaway:
- Too much revenue from one client = one budget cut can hurt hard
- Low cash runway = less time to fix problems
- Weak pipeline coverage = future revenue may not replace current work
- One main lead source = demand can dry up fast
- High utilization with low margin = busy work that does not leave much money
- Low recurring revenue = more month-to-month pressure
Quick Comparison
| Metric | What it checks | Healthy target | Main risk if weak |
|---|---|---|---|
| Revenue Concentration | How much revenue depends on one client or service line | < 20% | Too much dependence |
| Cash Runway | How long cash lasts if new work stops | 6+ months | Forced short-term choices |
| Pipeline Coverage | Future deal value vs. revenue goal | 3x | Not enough work in motion |
| Lead Source Diversity | How many channels bring in qualified leads | 3+ sources | One channel goes quiet |
| Utilization + Margin | Team workload and money left after delivery costs | 60%–75% utilization | Busy but thin profit |
| Recurring Revenue | Share of monthly revenue already locked in | 80%–100% | Unsteady cash flow |
I’d use this as a simple scorecard: check all six, find the weakest one first, and fix that before it turns into a bigger problem.
What Economic Resilience Actually Means for a Consulting Practice
Resilience isn’t busyness. It’s revenue durability. In plain English, it means your firm can take a client loss or a project delay without sending you into panic mode. This isn’t a fuzzy idea. It’s something you can measure.
In a consulting practice, resilience means a dip in revenue doesn’t push you into rushed pricing changes, heavy discounting, or hasty hiring calls. It comes from a mix of revenue sources, enough cash on hand, and a steady way to bring in new work. That shift matters. It helps you move beyond one-off projects and build recurring revenue with fixed offers like $5,000 diagnostics or $10,000–$15,000 retainers. Those kinds of offers can smooth income gaps and cut your reliance on any one client, service line, or lead source.[1]
The less your revenue depends on a single client, a single offer, or a single channel for leads, the steadier the business stays when demand changes. That’s what this scorecard is trying to surface: where revenue comes from, how long cash can carry the business, and how dependably new work replaces work that drops off.
Next, measure resilience with six metrics that expose concentration, cash pressure, and revenue volatility.
How to Use This 6-Metric Resilience Scorecard
Use the same five-part lens for each metric: Formula, Practical Definition, Healthy Range, Warning Sign, and Next Action. Apply that lens across all six metrics below.
Look at three time windows:
- 90 days for momentum
- 6 months for trend
- 12 months for durability
Each one shows a different layer of risk before it snowballs into a real problem.
If your practice is Microsoft-focused, score self-sourced business and Microsoft-influenced business separately. A strong overall pipeline coverage ratio can still hide too much dependence on one demand source, and inconsistent Microsoft referrals can point to a weak co-sell motion. [1][2] Breaking out each channel makes it easier to see whether your resilience leans too hard on one side of the business.
Review the scorecard weekly so the numbers stay current instead of going stale. Start with revenue concentration, because that’s usually where exposure shows up first.
1. Revenue Concentration by Client and Service Line
Start by checking how much of your revenue comes from one client or one service line.
Formula:
- Client Concentration: (Total Revenue from Client A ÷ Total Practice Revenue) × 100
- Service Line Concentration: (Total Revenue from Service Line X ÷ Total Practice Revenue) × 100
The goal is simple: no single client or service line should account for too much of total revenue.
A clear warning sign shows up when recurring revenue and 30-day revenue start to drift apart. That can point to billing timing problems or churn. For example, if your recurring revenue base is $15,200 and your 30-day revenue is $13,950, that’s a gap of roughly 8%. Small on paper, maybe. But it can flag risk early.[4]
As Matt Barron, Founder, Barron Tech, puts it:
“The more you depend on someone else to fulfill what you sold, the less ability you have to change the outcome. That’s the structural problem with services only work.” [3]
The fix is to build replacement revenue before concentration turns into a bigger issue. Then shift project clients into monthly retainers in the $10,000 to $15,000 range.[1]
If concentration is high, cash runway is the next test.
2. Cash Runway in Months
Cash runway answers a simple question: How long can the practice handle a revenue gap if no new work comes in?
The formula is straightforward.
Formula: Current Cash Reserves ÷ Average Monthly Operating Expenses
Say you have $45,000 in reserves and your practice costs $9,000 per month to run. Your runway is 5 months.
A six-month runway is a practical warning threshold. Drop below that, and a consultant living on savings alone, without repeatable revenue, can burn through cash fast. That’s when rushed decisions start to creep in.
A stronger cash buffer gives you room to operate with a clear head. You can charge at the high end, turn down poor-fit clients, and put money into growth. It also helps you stay steady while new work is still ramping.
Once runway is covered, the next test is how much future revenue is already in motion.
3. Pipeline Coverage Ratio
Pipeline coverage ratio shows how much qualified future work you have in motion compared with what you need to bring in. Put simply, it tells you whether enough solid opportunities are lined up to replace revenue before the period ends.
Formula: Total Qualified Pipeline Value ÷ Revenue Target for the Period
Healthy: 3x the period revenue target. Warning: below 2x. Critical: below 1x.
That word qualified does a lot of work here. Total leads don’t count. This metric only means anything when you’re tracking real opportunities with a credible chance of closing. A healthy pipeline comes from a repeatable flow of qualified opportunities, not the occasional referral or scattered outbound activity.
Use this ratio to shape decisions around pricing, client fit, and capacity. It gives you a clear read on whether new work is coming in fast enough to absorb client loss or deal slippage.
Review pipeline weekly. If coverage drops, step up prospecting or revive stalled deals.
If pipeline coverage is weak, the next risk to check is whether your lead sources are too concentrated.
4. Lead Source Diversity
If pipeline coverage tells you how much demand is in front of you, lead source diversity tells you where that demand comes from.
That matters because a full pipeline can still be fragile. If most of your qualified leads come from one place, you’re exposed. One partner can go quiet. One platform can slow down. One referral stream can dry up. Lead source diversity shows how concentrated your pipeline is and how much each channel adds to it. [1]
Formula: (Qualified Leads from Source A ÷ Total Qualified Leads) × 100, repeated for each channel.
Run this across partner-led, direct outbound, owned media, social/inbound, referrals, and warm outreach. The goal is simple: see which channels produce qualified leads on a repeat basis, and spot where too much weight sits on one source.
Healthy: multiple repeatable channels, with no single source dominating.
Warning: one source supplies most opportunities, or referrals are inconsistent.
When one source carries too much of the load, shift more effort into owned channels like email, LinkedIn, and structured outbound. That gives the practice more control instead of leaving growth in someone else’s hands. [1][2][3]
Track each channel on its own so you can tell which ones are steady and which ones only look good once in a while.
| Lead Source Category | Primary Characteristics | Key Metric to Track |
|---|---|---|
| Partner-Led | Sourced by external field teams or co-selling partners | Number of intros per month |
| Direct Outbound | Proactive outreach to cold or lukewarm targets | Conversion rate from outreach to meeting |
| Owned Media | Email lists and newsletters | Subscriber growth and click-through rates |
| Social/Inbound | LinkedIn engagement and content | Percentage of inbound inquiries that are qualified |
| Referrals | Word-of-mouth from past clients and network | Referral velocity (referrals per month/quarter) |
| Warm Outreach | Outreach to known contacts not yet in active pipeline | Re-engagement rate per outreach cycle |
5. Utilization Rate and Delivery Margin
After lead source mix, the next step is simple: check whether your delivery model turns demand into profit.
Utilization rate shows how much of your available capacity is billable. Delivery margin shows how much revenue is left after you cover the direct cost of delivery. You need both. Looking at only one can give you the wrong read.
Utilization Rate Formula: (Total Billable Hours ÷ Total Available Capacity Hours) × 100
Delivery Margin Formula: (Revenue − Direct Delivery Costs) ÷ Revenue × 100
A good way to read this pair: utilization tells you how loaded your team is, while margin tells you how much profit is left. Direct delivery costs include labor, subcontractors, tools, and other client-delivery costs.
Here’s where teams get stuck. A high utilization rate can look great on paper, but if delivery margin is weak, you may be running hard without keeping much money. That’s the hustle trap. You’re fully booked, yet your financial buffer stays thin. Every handoff can add cost and chip away at control, which squeezes margin.
Use these two metrics together to spot delivery that looks busy but feels fragile.
| Signal | What It Means | Action to Take |
|---|---|---|
| High utilization, strong margin | Efficient and durable | Protect capacity; raise rates |
| High utilization, weak margin | Busy, but not profitable enough | Audit delivery costs; tighten scope or pricing |
| Low utilization, strong margin | Capacity is available | Increase pipeline generation |
| Low utilization, weak margin | Demand and margin both need work | Reassess client mix and delivery model |
6. Percentage of Recurring Revenue
Next, track how much of next month’s revenue is already locked in. This metric shows what still comes in even if delivery slows down.
Formula: (Total Monthly Recurring Revenue ÷ Total Monthly Revenue) × 100
Recurring revenue includes monthly retainers, subscription offers, and bundled service-plus-software work. Leave out one-off projects and SOWs.
Aim for recurring revenue to make up 80% to 100% of monthly revenue. If collections drop below that floor, look at churn, billing timing gaps, or lost contracts.
Use this metric to guide pricing, grow your retainer mix, and treat project wins as upside only after baseline costs are covered.
With all six metrics defined, compare them side by side in the scorecard below.
Resilience Scorecard: All 6 Metrics at a Glance
Use the table below as a monthly scorecard for all six metrics. It gives you a quick read on where your practice is strong and where things may be getting shaky.
| Metric | Formula | Healthy Range | Watch Zone | Danger Zone | Why It Matters |
|---|---|---|---|---|---|
| Revenue Concentration | (Revenue from Largest Client ÷ Total Revenue) × 100 | < 20% | 25% – 40% | > 50% | Single-client dependence increases budget-cut risk. |
| Cash Runway | Total Cash ÷ Monthly Operating Expenses | 6+ months | 3 – 5 months | < 3 months | Covers the gap between spending and new revenue. |
| Pipeline Coverage | Total Pipeline Value ÷ Revenue Target | 3x | Below 2x | Below 1x | Shows whether enough qualified deals are in motion. |
| Lead Source Diversity | Count of lead channels producing at least 10% of qualified leads | 3+ sources | 2 sources | 1 source | Reliance on a single channel creates a single point of failure [1][2]. |
| Utilization Rate | (Billable Hours ÷ Total Available Hours) × 100 | 60% – 75% | 40% – 55% | < 40% or > 90% | Too low hurts profit; too high hurts quality. |
| Recurring Revenue | (Monthly Recurring Revenue ÷ Total Monthly Revenue) × 100 | 80% – 100% | 50% – 79% | < 50% | Recurring revenue steadies cash flow and reduces monthly deal pressure. |
If all six metrics sit in the Healthy Range, your practice has room to handle a slow month, lose a client, or pause outreach without sliding into a crisis.
But one Danger Zone score can throw off the whole picture. That’s the tricky part. You can look fine in five areas and still have one weak spot doing quiet damage behind the scenes.
Check this scorecard every month. Treat any Watch Zone result like an early signal, not something to shrug off. If a metric lands in Watch or Danger, fix the weakest link first.
What to Do When Your Scores Point to Risk
Once the scorecard shows risk, start with the weakest metric first. If one metric is weak, the fix usually needs to change the structure of the business, not just the surface. If several metrics are weak at the same time, you need a different kind of response.
A weak pipeline usually points to a positioning or business-development issue, not a tooling issue. A low share of recurring revenue usually means you need more fixed-fee work. Tie each fix to a clear decision - pricing, client mix, or business-development rhythm - instead of making a vague adjustment.
Don’t rebuild the whole practice during a slow stretch. Keep the repeatable outreach and asset-building work that creates steady demand. Stick with it long enough for those efforts to compound.
If delivery margin is weak, reduce handoffs, own more of the delivery loop, and use AI or automation to shorten the path from request to delivery. Weak margin pushes changes in pricing, scope, or the delivery model itself. And those changes get a lot easier to see once you know which metric is creating the pressure.
Then run the scorecard again in the next cycle.
Conclusion
Economic resilience can be measured. These six metrics show where client loss, cash pressure, and uneven income can put stress on your practice. The scorecard matters for one simple reason: it turns early warning signs into decisions before they turn into bigger problems.
Revenue concentration shows your exposure. Cash runway shows how much time you have. Pipeline coverage, lead source diversity, utilization, and recurring revenue show whether the practice can replace lost income and protect margin.
Once you know which metric is weakest, the next move is simple: review it on a set schedule and act fast. Review the scorecard monthly. Over time, higher recurring revenue and lower client concentration make the practice more predictable, durable, and easier to price and sell.
The goal isn’t perfection. It’s finding the metric that puts the practice at the most risk and making one clear move to fix it.
FAQs
Which metric should I fix first?
Start by diagnosing your weakest income source. If revenue is dropping fast, check active contract counts, recent cancellations, and billing timing anomalies first. That helps you see whether the dip is temporary or points to a deeper problem.
Heavy reliance on one revenue source is a major risk. So the goal is to build a steady income base. Use your Economic Resilience Snapshot to find weak spots, then review those points each week to help keep the system stable.
How often should I review these metrics?
Review these metrics monthly to spot your weakest income sources and keep your business steady when things shift.
Then check them on a weekly cadence so you can act on what you find, handle tradeoffs, and build long-term stability.
What if my practice is mostly project-based?
If your practice is mostly project-based, focus on turning one-off work into steadier monthly revenue. A simple way to do that is with fixed-scope offers, like a $5,000 diagnostic or a $10,000 to $15,000 retainer.
Project-only income can swing from month to month, which makes planning harder than it needs to be. That’s why it also helps to spread out your lead sources and build a pipeline you can count on.
When your messaging is tighter and your offer positioning is clear, sales gets a lot less random. You start building a repeatable sales motion, cut your dependence on any single client, and put the business on firmer ground.